Light Pattern and Intensity Analysis of Gray
Spots
Surrounding Polar Dunes on Mars.
The NASA Mars Global Surveyor (MGS) Mars
Orbiter Camera (MOC) took the image below in December of 2002. It shows dark
gray spots surrounding crescent shaped dunes that lie in the northern polar
regions of Mars.
Explanations for the gray spots, has been attributed to seasonal defrosting
of CO2 and streaks of dark sand. Although even NASA’s own descriptions of
the spots come with qualifiers such as: “though not well
understood”, “speculation”, “this is thought to be”, “unknown is whether”, and
“much that remains unknown”. If the gray spots are in fact melting CO2,
then it could be expected to find examples of spots that have grown in size, or
have merged to form larger irregular shapes. However, a search of the
Malin Space Science System’s online database of over 134,000 images located 28
images containing spots, and no correlation between season and spot size/shape
could be made.
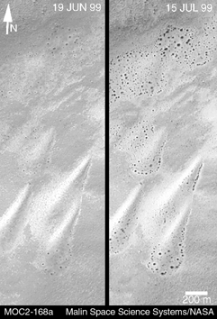
MGS MOC2-168 image is intended to support the melting CO2
explanation, however; the MO3-02916 source image for the 7/15 view has 2.2X
greater image resolution than the M02-02528 source image for the 6/19
view. So it is debatable whether the apparent increase in size is due
to the higher resolution or the 26 days of warming.
An alternative
explanation of the gray spots is that they are shadows cast by mound-like
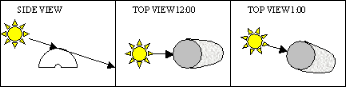
features on the surface of Mars. Five properties of light and shadow –
orientation, length vs. inclination, shape vs. surface, intensity, and phase
angle – allow measurable analysis of the spots to be conducted.
The
following sketches provide a simple explanation of the five methods used to
analyze the MOC images:
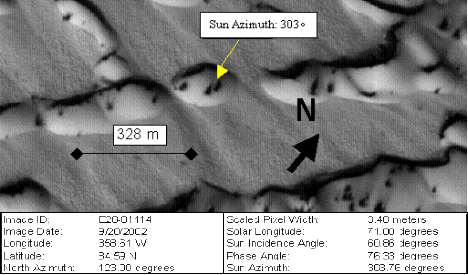
1. Shadow orientation lines up with direction of
sun.
2. Shadow length varies with inclination of sun.3. Shadow shape varies with surface geometry.
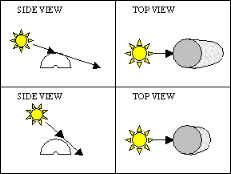
5. Shadow phase varies with viewing angle.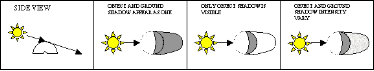
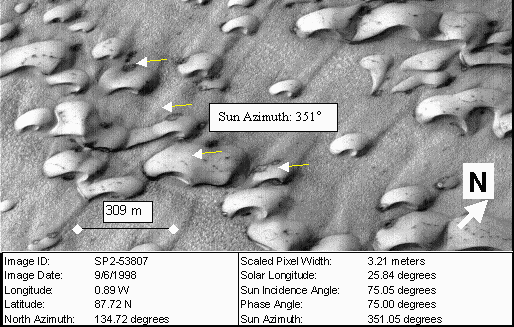
In all, fourteen images were looked at in detail. These NASA images comprise an area of 698 km2 and contain an estimated 11,100 spots, with image resolution ranging from 1.61 meter/pixel to 15.72 meter/pixel. The results of all five methods of spot analysis match the values expected of large mound-like features creating shadows visible from space.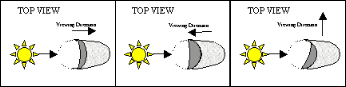
SHADOW LENGTH VARIES WITH SUN
INCLINATION
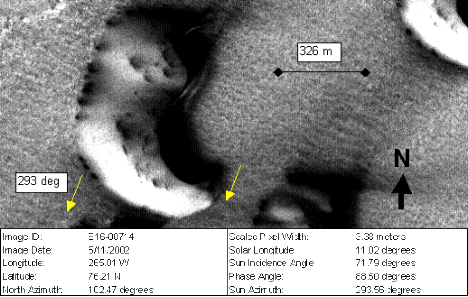
Image
E16-00714 was taken on 5/11/2002 and has a sun inclination of 71.79° from
vertical. On 7/9/2002 image E18-00494 captured the same dune field.
This image has an inclination of 61.41°. The 10 degrees difference allows
for a measurable difference in shadow length.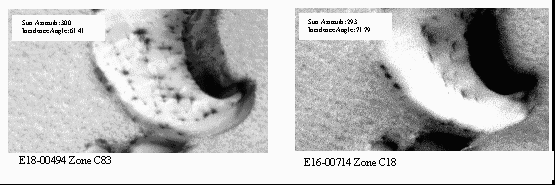
For sun angle a
(90° – incidence angle), if an object height is set equal to 1, shadow
length l equals 1/tan a. For image E18-00494 l equals
2.003 and for image E16-00714 l equals 3.143. Thus gray spots in
image E16-00714 should measure 56.9% longer than gray spots in identical
locations in E18-00494.
Five of the clearest spots in image E16-00714
were measured and they proved to be 30-65% longer than the corresponding spots
in image E18-00494. Due to the faintness of the shadows in E16-00714, it
was difficult to measure the shapes with any precision, but this agrees in
magnitude and direction with the predicted 56.9% value.
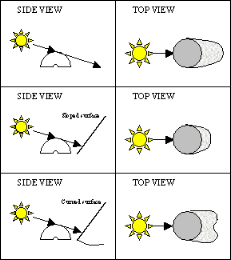
SHADOW SHAPE
An object’s shadow will vary in shape depending on the surface it
falls on. The shadows will appear short and fat on a steep slope, long
thin on flat ground, and curved on a side slope.
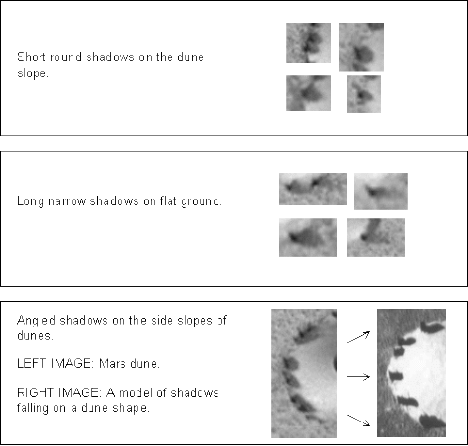
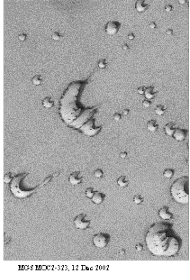
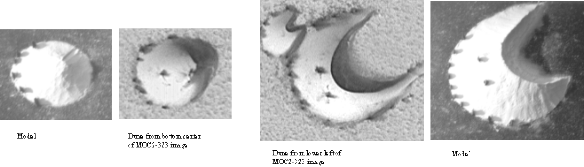
Image MOC2-323 offered very clear gray spots with
image resolution of 3.38 meters/pixel. As shown below, the gray spots
matched the patterns expected of shadows.
Seeing gray spot shapes
matching the expected distortion of shadows falling on irregular surfaces is
compelling, but it is only possible to quantify if the geometry of the surface
is known. For example, the length of an object’s shadow falling on a known
slope angle can be calculated and related to a shadow falling on flat
ground.
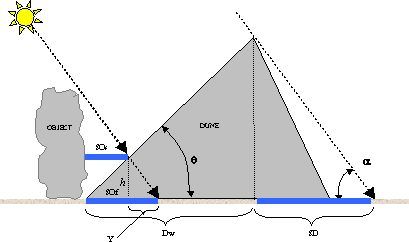
Given Sun Angle, a, and Slope Angle,
q, the expected slope shadow length can be calculated and
expressed as a ratio of slope shadow / flat shadow. Height,
h, is equal to the TAN (slope angle, q) times the length of
slope shadow, Sos. And h is also equal
to the TAN (sun angle, a) times the length of flat shadow minus the
length of slope shadow, SOf - SOs, or Y,
then
TANa * Y = TANq * SOs
If SOf
is set equal to 1, and SOs = 1 - Y,
then
Y = TANq / TANq + TANa
From this the
ratio of the dune slope shadow / flat shadow (1-Y / 1) can be calculated.
For q=15 and a=25, slope shadows should measure 63.5% of the
length of flat land shadows. This can then be compared to the ratio for
actual measured slope and flat shadows.
It is fortunate that the gray
spots in several of the images are falling on Barchen dunes. Barchen dunes
are well studied on earth. The dunes are formed in areas where the wind
blows consistently from one direction, resulting in well-defined shapes and
profiles depending on size. Per the USGS the windward slope of the dunes
range from 10 to 15 degrees.
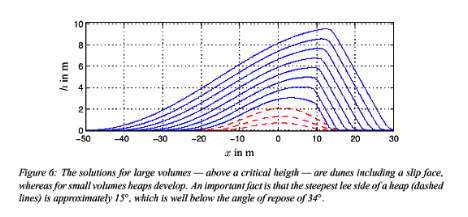
Additional characteristics, such as
the variability of dune height and brink location in relation to dune size, are
described by "Saturation Transients in Saltation and their Implications in Dune
Slopes", Feb 2001, Sauermann, Kroy, & Herrmann (reference figure
below).
Factors unique to Mars, such as lower gravity and frozen CO2
in the soil, may cause the slope angles to vary from earth’s 10-15 degree range,
but the nearly uniform slope angles of the windward and lee slopes of the dune
should remain consistent.
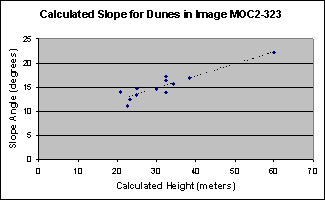
Since the dunes and dune shadows are very
pronounced in the MOC2-323 image, the dune shadow length and dune length (from
leading edge to brink) can be accurately measured. From this utilizing the
25.47-degree sun angle provided in the ancillary data can derive the dune
slope.
Twelve dunes were measured, yielding an average slope of 15.2
degrees. Plotting the slope angle in relation to dune height shows the
relationship of increasing windward slope angle with increasing dune
height. This is consistent with the above dune profile chart provided
Sauermann, Kroy, & Herrmann.
Using the 25.47 degree sun angle and the 15.2 degree
slope angle in the equation, Y = TANq / TANq + TANa,
results in a
Predicted Slope shadow / flat shadow ratio of
63.68%
In order to compare actual Slope Shadow / Flat Shadow Ratio
with the above predicted value, measurements were taken of seventy gray spots in
the MOC2-323 image. Only gray spots with "two pixel" black spots were
chosen for ease of measuring.
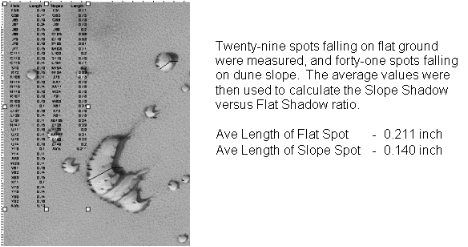
This equates to a
Measured slope shadow vs
flat shadow ratio of 66.35%.
Considering the image resolution and the
measurement method, the errors in measuring dune length, dune shadow length, and
gray spot length can easily account for the difference in predicted value,
63.68%, and measured value, 66.35%.
SHADOW INTENSITY
The MGS Mars Orbiter Camera is essentially a device that records the
amount of sunlight reflected upward by the various surface features of
Mars.
Bright surface images are areas reflecting more sunlight,
black images are reflecting less. Three factors affecting the amount of
reflected light are: 1) Surface Slope, 2) Obstructions (causing shadows),
and 3) Surface Reflectivity
1) The dunes are a
great example of the effect of slope on sunlight. They have a nearly
uniform composition, and therefore reflectance, yet the dune images vary from
bright white to dark gray, depending on the slope angle in relation to the
MOC.
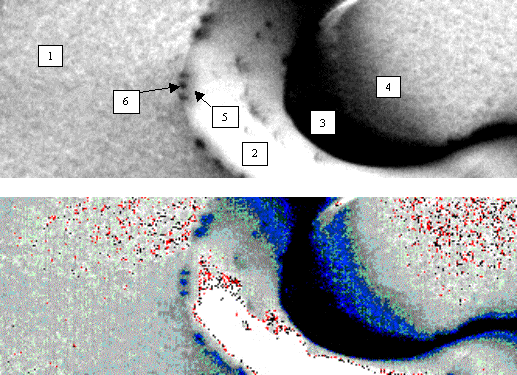
2) The dunes also provide examples of
obstructions when the leeward slope angle of a particular dune is greater than
the sun incidence angle. This results in the dune shadow causing the
leeward slope and flat ground to appear darker (see number 4 in image
below).
3) The gray spots, which usually consist
of a small almost black spot and a larger gray area, could be the result of low
reflectance material (dark sand exposed by melting CO2 and a lighter gray
drifting sand area). Or they could be shadows cause by
obstructions.
Measuring light intensity can provide a method of
comparative analysis of shadows cast by the sand dunes and the gray spots.
If the intensity is similar, it is another sign that the gray spots are
shadows. It is possible for dark sand to return the same light levels, but
that would be an unlikely coincidence.
The section of
dune below, which is located 1.8 km from the left side of the E16-00714 image
and .4 km from the top, was measured for light intensity in order to compare the
gray spots to dune shadows.
The section of dune was imported into Adobe Photoshop 6.0 as a grayscale
image. Using the cursor, the six zones were scanned and the highest “k”
value for each was recorded. This tools reports a value ranging from
0-100%. The following are the results:
Six of the spots
were scanned and in each case 81% was the highest value recorded for the black
spots (blue in Adobe image). This “Feature in Shadow” value compares
fairly closely to the “Dune in Shadow” high value of 84%. The “Dune Shadow
on the Plain” and the “Mound Feature Shadow on the Dune” values were comparable,
with each having two zones of intensity measuring 40% and 53%. For the
intensity values of the dune shadows and the spots to be so closely matched is a
good indicator that the spots are also shadows.
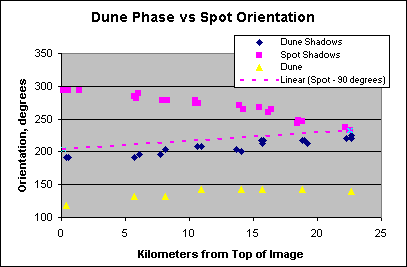
SHADOW PHASE
The spots in image M20-00416 initially
presented a mystery. The direction of the spots at the top of the image
matched the 301 degree sun-angle, but near the bottom of the 23 km long range of
dunes, the spots had a 230 degree alignment. If the spots were drifts of
dark sand, then changing wind direction could explain the shift. But the
alignment didn’t appear to be affected by local geography, as is the normal case
with wind.
In the M20-00416 image the change in spot direction from 301
degree to 230 degree seemed to be related to the distance from the top of the
image. To verify this, spot direction versus distance was measured
and plotted.
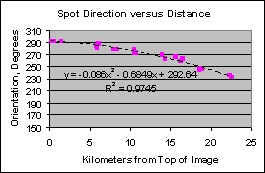
As can be seen from the above graph, the plotted spot direction
does not appear random and there is a relationship with
distance.
To determine what may be
causing the shift in this image, the ancillary data for image M20-00416 was
compared to the ancillary data of the other eight images that had spot alignment
with sunlight.
According to the Malin Space Science System explanation of
the Ancillary Data, Emission Angle in most cases is close to 0 degree, i.e. the
MOC is looking “straight down”. In those cases the Phase Angle equals the
Incidence Angle. Of the 14 dune images with spots, six turn out to have
high Emission Angles. In five of those cases, the Emission Angle plus the
Incidence Angle equals the Phase Angle, meaning the MOC was angled toward the
direction of the sun and the MOC direction of flight (side viewing angle = 0
degree). Only image M20-00416 departed from this norm.
The M20-00416 image was taken with the MOC “looking away from the sun”
with the 16.29 degree Emission Angle subtracting 7.47 degree from the Incidence
Angle to arrive at the Phase Angle. As it turns out, not only was the MOC
recording this image from the opposite direction of the other images, there was
also a side-view angle involved. This turns out to be the most plausible
explanation of the spot direction change, as a side-view of an object in shadow
would result in a shadow phase change (like the phases of a moon) if the
viewpoint (MOC) changed during the image recording process.
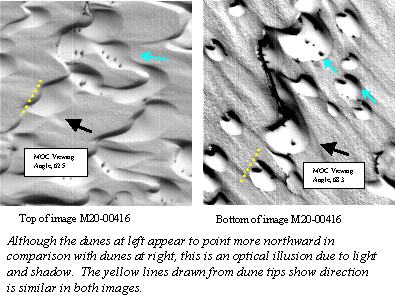
If the spots
are changing phase, so to must the dune shadows. The samples of the
M20-00416 image below are a side-by-side comparison of a portion of the top of
the dune field (left) and a portion 22km lower near the bottom of the dune field
(right). It is readily apparent that the dune phase direction (indicated
by blue arrows) has changed from nearly horizontal to a 45-degree
angle.
A change in phase will result if there is a change in MOC viewing
angle. General orbital data, ancillary data, and simple geometric
calculations were used to approximate this change. An orbit period of
117.65 minutes, altitude of 378 km, and 3397.2 km radius of Mars were used to
calculate the speed of the MOC (3.41 km/sec). Utilizing the ancillary data
for the image, a .4821-millisecond line integration time and 7680 lines were
used to arrive at image recording time for the range of dunes (2.581
seconds). This results in an 8.8 km movement of the MOC during the time
needed to record the 23 km image of the dunes, causing the viewing angle to vary
from 62.5 to 68.3 degrees, and Phase Angle to vary by 1.85 degrees.
The
cumulative effects of viewing angle and phase angle shift would require a
computer model to predict the image changes and compare those to measured
changes. Absent this, a comparison of dune shadow shift versus spot
direction shift was made.
The plot of dune shadow direction (blue diamonds), measured through
the chord of the dark-side shadow, follows a curve upward, where at the 23 km
location it meets the curve of the previously plotted spot shadow direction
(pink squares). Both the dune (phase) and spot shadow direction seem to
change in relation to distance, only in opposite directions. This should
not be the case.
The explanation for this is that the spots at the
top of image M20-00416 have a resolution that captures the image of the shadow
cast on the dune; whereas, the spots at the 23 km location only shows the
“mound” shadow (reference Item 4 in the properties of light section). If
90° is subtracted from the first point for the spot direction, and a line is
projected to the last point (dotted pink line), it results in a fairly close fit
to the dune phase.
CONCLUSION
In order to
get a rough check of the size calculations and to visualize what the mound-like
features would look like around the dunes, a model was created and photographed,
thus providing an approximation of how the ground view of the dunes and objects
would look.
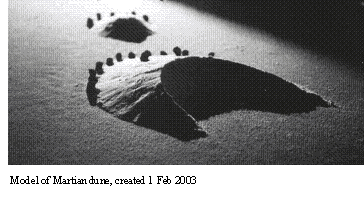
Comparing the model to similar dunes in the MOC2-323 image shows how the
shadows are a fairly close match to the gray spots in the MOC2-323 image.
Note: the dark gray spot offset from the lighter gray portion of the spot,
the shorter shadows at the front edge of dune/model; and the curve of the shadow
around the sides of the dune/model.
If only one NASA image of Mars containing spots was used, the results may
be too unusual to believe, but that is not the case. Altogether fourteen
NASA MGS MOC images were used in the analysis of the spots surrounding polar
dunes. The images cover a combined area of 698 km2, contain an estimated
11,100 spots, and have a resolution ranging from 1.61 meters/pixel to 15.72
meters/pixel.
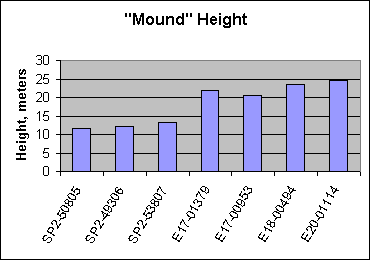
Using the solar inclination values in the ancillary data and the
average length of ten shadows in each image, the height of the Martian
mound-like features casting the gray-spot shadows was derived. They
are as high as six-story buildings, ranging from 11.7 to 24.5 meters
Five methods were used to analyze the images –
spot orientation with respect to sunlight; spot length with respect to sun
inclination; spot shape with respect to surface geometry; spot intensity versus
known shadow intensity; and spot orientation compared to dune phase. In
each case the measured values were in agreement with predicted values for a
surface feature causing shadows.
Although the analysis does not exclude
the possibility that some spots are the result of melting CO2, no correlation is
evident in these fourteen images to support the melting CO2 explanation.
One of the images in support of this theory is MOC2-168. This side-by-side
comparison of two images, one taken 6/19/1999, and the other taken 7/15/1999,
does appear to show an increase in spot size. However, the source image,
M02-02528, for the 6/19 portion of the MOC2-168 image has a resolution of 4.15
meters/pixel with a cross-track summing of 3 – yielding a net resolution of 12.5
m/pixel. Whereas the M03-02916 source image for the 7/15 half of MOC2-168
has a 5.54 m/pixel net resolution. Therefore it is questionable if the
apparent increase in size in the MOC2-168 image comparison is a function of the
2.2X increase in resolution, or due to the advancing season.
In order to
check the effect of season on spot size, ten spots in seven of the images were
measured. A plot of size versus season (provided in NASA ancillary data)
was created, where 0 degree = beginning of spring, and 90 degree = end of
spring. The results show that, if anything, the spots grow smaller with
the advancing season.
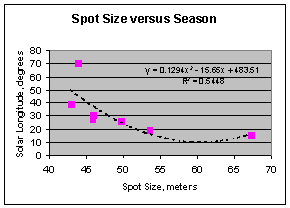
There appears to be no correlation with spot size and time of
year; and counter to what would be expected if the spots were melting CO2,
the largest spots were measured in the earliest spring
image.
Using the same measured size
(length) data, a second plot of size versus solar inclination results in an
average spot (shadow) length (indicated by pink squares) that increases as the
solar inclination increases (sun lower on the horizon). This is
inline with expectation if the spots are caused by shadows.
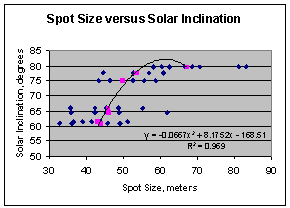
Measuring the average length(size) of the 10 largest and/or
clearest spots in seven of the northern polar dune images, and plotting it
against sun angle shows that, as expected, lower sun angle results in longer
shadows.
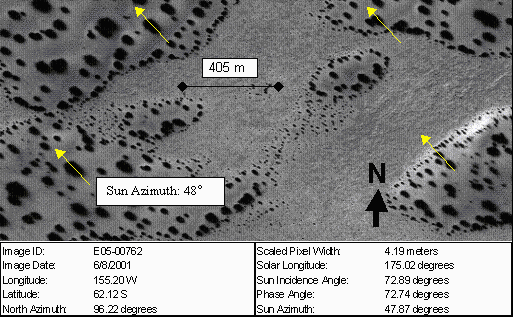
Eleven images of southern
polar images containing spots were analyzed, but only image E05-00762 had spots
that aligned with sun direction. Either the process creating the spots in
the south are creating significantly lower “mounds”, making it more difficult to
see and measure shadows, or the spots in image E05-00762 are not mounds and it
was only coincidence that the spots lined up with sun
direction.
Additional research will be needed to determine the nature of
southern spots.
 |
 |
 |