The discovery that the gray spots around polar dunes on Mars are shadows cast by surface features measuring upwards of 25 meters high and numbering over 11,000 in the 14 images analyzed [1] leads one to question the nature of these ìmoundsî. How did they form? What are they composed of? Are they a mineral deposit or life form? This study proposes possible answers to those questions through the analysis of additional image details. One of the best clues providing insight into the nature of the ìmoundsî are the ring shadows in observed in five MGS MOC images.
MOC E20-01114 MOC M20-00416 MOC SP2-50805 MOC SP2-53807 MOC M19-01495
Through detail analysis of these rings and two other MOC images containing elliptical shadows, the height to width ratio, height above ground, internal structure, ring thickness to diameter relationship and several other features are characterized.
2 Ring Shadows and Planetary Nebulae
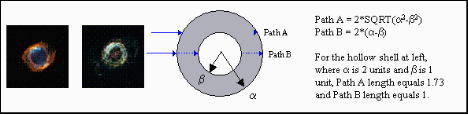
As many planetary nebulae appear as rings, the phenomenon of ring images are familiar to astronomers. In the case of these nebulae, the ring is actually a hollow shell of expanding gas that is emitting and absorbing light relatively uniformly. But in a viewerís line of sight more light is emitted along the periphery, so the outer ring is brighter. And because this light must travel further through the shell of gas (see Fig 2) more of the short wavelength light is re-absorbed by the gas, resulting in the nebulae rings often appearing in reddish coloration.
NASA STScl-2003-11 NASA STScl-2002-25
The rings on Mars are most likely caused by the same phenomenon. The ìmoundsî are spherical with a layer that partially absorbs the light passing through it. The absorption layer absorbs more light at the periphery and causes a ring-like shadow on the ground.
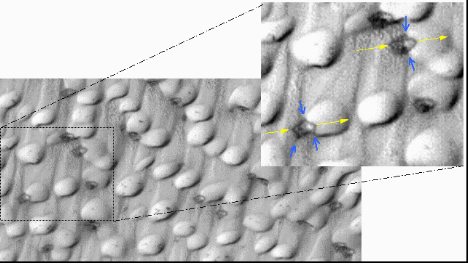
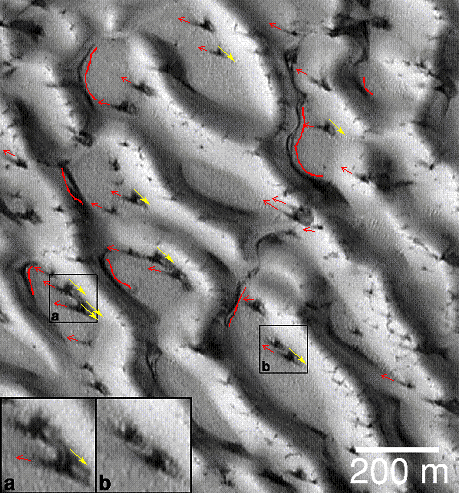
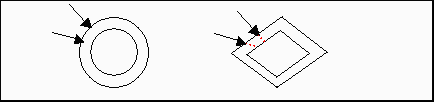
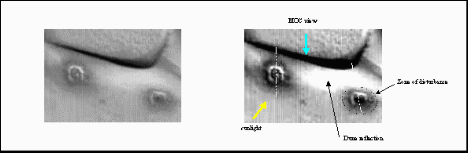
As can be seen in the ring images above, in each example the direction of orientation of the ring lines up with the direction of sunlight (yellow arrows). Also the effect of dune slope on shadow is very apparent as noted by blue arrows.
And in another similarity to planetary nebulae, the line of the dunes is visible through the center of the ring, as are stars through the center of planetary nebulae.
3 Height to Width Ratio
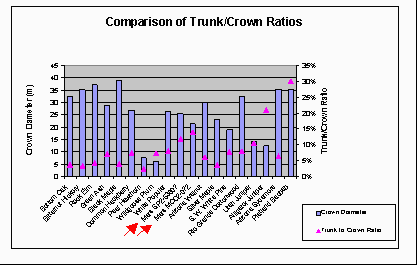
In the case of the ring shadows, the width, as well as shadow length, are large enough to be measured. This allows the height-to-width ratio of the shape to be determined.
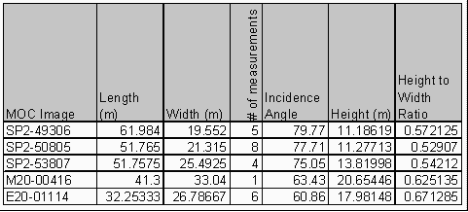
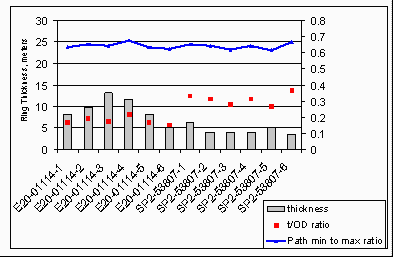
Ring shadows were measured for length and width in five of the NASA MOC images by inserting the images into Microsoft Excel and using the line tool. With the incidence angle provided in the NASA ancillary data and the corresponding average shadow length, the average height of the mounds was derived (Shadow Length * TAN Incidence Angle) for each MOC image. The results, shown in Chart 1, indicate a fairly consistent height to width ratio with the average ranging from 53% to 67% between the five images.
However, due to the shape of the ìmoundî, the derived height-to-width ratio can be considerably off. To correct for the error in derived height the profile of the shape must be determined.
4 Graphical Method of Determining Profile
In calculating the height of an object by using sun angle and measured shadow length, the shape of the object can greatly influence the resulting derived height. As shown in the figure below, a low elliptical object with a height-to-width ration of .5 will result in a derived height of 11.2 at an incidence angle of 79.7, but will result in a derived height of 15.4 at an incidence angle of 60.8.
To graphically determine heights H1 to H3 (reference Fig. 5) an ellipse with width equal to the average width of rings in image SP2-49306 was sized (vertically) to fit within the parallel lines of the sun angle and the intersection with average shadow length (L1A & L1B). Average shadow length and width measurements from image SP2-49306 were used as a starting point since the sun angle of 79.77 provides the closest measure of true height.
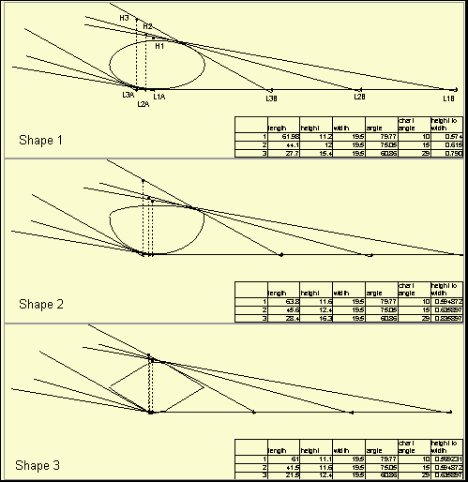
After the shape was fit, a vertical line was projected from Point L1A up to Point H1 (the length of this line equals the previously derived height). The procedure was repeated for sun incidence angles of 75° and 60°, drawing the lines tangent to the shape and projecting vertical height lines from Points L2A and L3A. As can be seen, height H2 and H3, are considerably higher than the true height of Shape 1.
Repeating the graphical method for Shape 2 and Shape 3 provides a rough method of determining the profile of the shadow causing shapes. By comparing the height to width (H/W) ratios of the three shapes above to the H/W ratio derived using measured data, the third shape is the closest match.
5 Zone of Disturbance
Although direct images of the shadow producing shapes do not appear to be visible, a close examination of the area around the ring shadows does reveal subtle evidence of the source. Dune slope has a very smooth appearance (either light or dark depending on sun angle in relation to slope), while areas of flat ground have a distinctive mottled pattern. Surrounding some rings is an area that I will call the disturbance zone, in which the dune and flat ground patterns are both disrupted. This is not easy to see in a printed image, but the NASA MOC image downloaded as a 4,714 KB .gif file and imported into Microsoft Excel was clear enough to view it. In the middle image of the series below, phantom lines have been circled around the disturbed zone. And in the third image, contrast has been increased to 85% and brightness decreased to 38%, which has the effect of causing the disturbed ground pattern to turn dark.

The diameter of the disturbance zones around five rings in the image above was measured. This measure can be expressed as an average ratio of zone diameter to outer diameter of ring. The result is a ratio of 1.67. This relationship is important as it is needed to derive the absorption layer thickness.
6 Absorption Layer Thickness in Relation to Ring Diameter
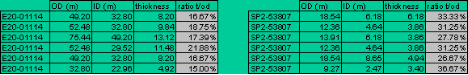
In planetary nebulae there is a set volume of gas in the shell, or absorption layer, so as the nebulae expands the thickness of the absorption layer shrinks in relation to the diameter. To determine if the absorption layer of the shadow rings was a constant thickness, random, or varied with diameter, the ring thickness of the clearest ring images were measured. Although better tools for image analysis at this level of detail probably exist, for this study MOC image E20-01114 and image SP2-53807 were imported into Microsoft Excel and the line tool was used to measure inner and outer diameters.
The change from dark to light at the boundaries of the ring shadow is a gradual transition rather than a discrete ON/OFF. Lacking sufficient resolution to determine I.D. and O.D. by measuring image intensity and setting limits to a predetermined value, considerable tolerance uncertainty is unavoidable. But by visually selecting the same shade of gray with care, every effort was made at consistency.
Results of 12 measured spots show thickness, ½ (O.D. ñ I.D.), having a wide variance, ranging from 3.40 to 13.12 meters. Comparing ring thickness to ring O.D. shows some correlation within image set % to % for image E20-01114 and % to % for SP2-53807. But if all 12 data points are considered together the result is % +/- %, which seems to indicate there is no direct relationship between thickness and O.D.
One measure of the ring shadow that can be determined with some certainty is that sunlight travel-length through the absorption layer must be equal at the I.D. and O.D. of the ring shadow. With the actual boundary of the absorption layer being XOD and XID, the light paths LID and LOD (red lines) must be equal for the shadow intensity to be equal.

This fact allows Lmin, which occurs at the center of the ring, to be compared to Lmax, which occurs at the tangent to XID.
Where:
LOD = 2*SQRT((XOD/2)2 - a2)
LID = 2*SQRT((XOD/2)2 - b2) ñ 2* SQRT((XID/2)2 - b2)
Lmax = 2* SQRT((XOD/2) 2 - (XID/2)2 )
Lmin = (XOD ñ XID)
Setting the equations for LOD and LID equal gives us:
XID = 2*SQRT(( SQRT((XOD/2)2 - b2) - SQRT((XOD/2)2 - a2))2 + b2 ).
Since XOD (the zone of disturbance) was measured in the prior section, and was found to be 1.67 * Ring OD, then XID, Lmin and Lmax can be solved and the ratio of Lmin/Lmax for each ring can be compared.
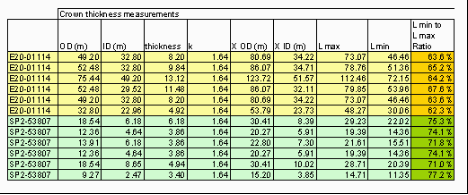
The path length ratio variation is fairly small within MOC images, being 64.4% +/- 2.6% for rings in image E20-01114, and 73.9% +/- 3.1% for image SP2-53807. The larger variation between images can be explained by the angle of solar inclination. For one image it is 60.86° and the other it is 75.05°. If the shape were a perfect sphere, the angle of inclination would not affect the absorption path calculation. But as determined in section 4 Graphical Method of Determining Profile, the profile is more likely to fit the form of Shape 3, and this shape does affect the path calculation.
For a perfect sphere the sunlight through the center is always normal to the sphere and the path length through the absorption layer does not change. For an angled profile, the path increases in length as the sun angle goes lower.
Assuming a profile slope of 38° for the absorption layer (this being equal to the maximum angle of sun), and setting thickness equal to one (1), then path length can be solved for angle q, where q equals sun angle + 38°. For the 60.86 and 75.05 angles of inclination in E20-01114 and SP2-53807, path lengths equal 1.252 and 1.085 respectively.
Dividing Lmin values by the correction factor yields an Lmin/Lmax ratio for E20-01114. This can be used to adjust the path length for Lmin in SP2-53807 and recalculate the ratio. As can be seen in the plot, for ring thickness varying from 13 to 3 meters, the Lmin/Lmax ratio (blue line at top) is a consistent 64%.
This implies that the thickness is being regulated by some form of feedback mechanism that holds the relationship between shortest light path and longest light path to a set ratio. Since a biological organism is the only thing imaginable that has a need of, or is capable of, controlling its size in order to regulate the absorption of sunlight, and because the shape and size of the absorbing spheres is so similar to earth trees, I will start referring to them as trees.
7 An Earth Analogy
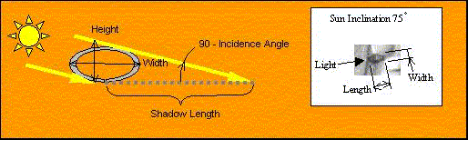
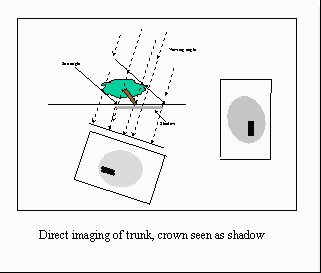
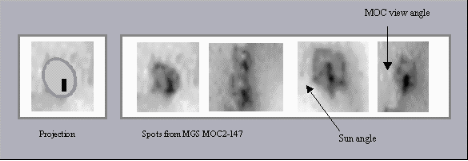
To better visualize what a tree with a thin canopy would look like from space, a projected image was drawn to show how it might look. Using the estimated MOC viewing angle and the solar incidence angle from MOC2-147, a tree with a height to width ratio of 50% was projected in the manner the MOC would image it.
The canopy shadow is projected down to the ground at the sun angle, while the tree trunk is imaged directly at the angle of the MOC. At the 3m/pixel resolution of this MOC image, details like branches blur into the background.
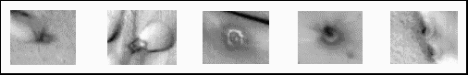
As can be seen below, the projected image is a close match to spots from the MOC2-147 image.
8 Thin Radiating Streaks
Earth satellites with similar resolutions to MGS MOC, such as IKONOS, are actively being used to monitor and catalog natural resources such as plant growth rates, type of vegetation, and year-to-year changes. An attempt was made to find images similar to the Mars ring-like shadows, but lacking a budget to access image catalogs nothing similar was found in public photos.
Although no ring image was located, information regarding issues of radiating streaks in digital satellite imagery was found. Objects such as trees and bushes cause thin radiating lines in unfiltered images. Special algorithms are used to remove these high frequency spikes, while still retaining enough detail to delineate individual trees/shrubs.
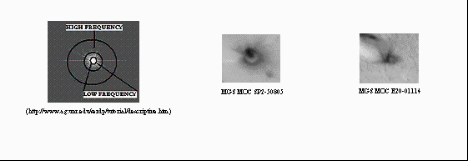
Per "A Remote Sensing Tutorial for Natural Resource Managers" high frequency noise exhibited as thin radiating lines, can be a problem with remote sensing of trees and shrubs. The ring shadows in MOC image SP2-50805 and E20-01114 also exhibit radiating streaks, which imply a structure similar to trees and shrubs on earth.
In the Mars Orbital Camera images, as reported by NASA: “Many of the dark spots [in image SP2-50805] have thin, dark streaks that radiate in several different directions.”
Although it was theorized that the streaks were caused by passing winds that mobilized some of the dark sand at each location. The thin, upward-pointing rays run perfectly straight, whether on flat ground or curved dune surfaces. Even if the wind blew the sand in a straight line over the dune surface, from space the line would appear to curve (bend this piece of paper and you'll see how the line above becomes distorted). It is more likely that the thin streaks are digital noise, and indicates that the inner structure of the Martian trees is similar to trees on earth.
9 Reflected Ring vs. Shadow Ring
In MOC image M19-01495 two circular white rings are visible at the base of one dune. As well as being white rather than black, these rings are not distorted by the dune slope in the manner of shadow rings. That is because these white rings are most likely formed by sunlight reflecting off frost on the foliage, and since the rings not shadows on the ground, the dune slope does not affect their shape.
It is fortunate the MOC captured this reflected ring image because it provides additional insight into the nature of the trees. For an object to reflect a ring requires a certain structure or organization. A simple spherical crown would reflect a bright spot the way a dune reflects sunlight (note: bright area on dune in image above).
One possible shape is a sphere with its top removed. Since the ground is visible in many ring images, this could very well be the configuration. Both these rings have a section of the ring missing in the same location. Since this roughly coincides with the windward facing side of the dune, perhaps wind has blown the frost loose or has distorted the tree in this zone. The biological advantage of this configuration seems rather unlikely. Also, because the circle is flat, it would not strongly reflect sunlight up to the MOC.
Another tree configuration that better satisfies all the visual clues is a layered structure similar to Balsa or Spruce. Some layers would be at an angle that would trap sunlight, while other layers would be at an optimal angle to reflect light up toward the MOC.
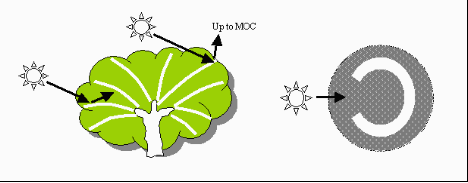
Because upper layers would block the reflected sunlight on the sunny side of the tree, the resulting reflection would look like a ìCî. The gap in the ìCî would face the sun if the MOC viewpoint were directly overhead, but the gap would align more towards the viewpoint if it were at an angle.
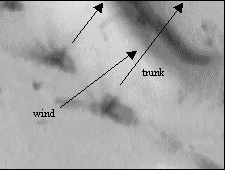
10 Tree Trunk Slant Due to Wind
Barchen dunes form in areas where the winds blow consistently from one direction. Trees on earth exposed to steady wind tend to grow/lean with the wind. If trees on Mars slant with the wind, the tree trunk would appear to point above the prevailing wind direction when viewed from the MGS MOC camera. As can be seen in the image below, that is exactly the case.
The apparent angle between wind direction and tree trunk direction (q) depends on the MGS viewing angle and degree of tree slant. Assuming MOC viewpoint is 90 degrees to wind direction, then